


Importance Of Reading Forex Charts for Beginners
Importance Of Reading Forex Charts for Beginners
Forex trading is the jungle of smart people and professionals who love and play with skilled investment
-

- by ALLFOREXRATING.COM
- 26th June 2022 | Post Views: 1248

Forex trading is the jungle of smart people and professionals who love and play with skilled investment. So, if you are a beginner to this lavish bunch, then one of the first things you need to learn is how to read forex charts.
Charts are an essential tool for all traders, providing valuable information that can help you make more informed and successful trades. In this article, I have covered everything that you need to get a better overview of the importance of reading forex charts and patterns for beginners. So, let me get started.
What is a Forex Chart?
A forex chart is a price chart that helps traders to recognize patterns, gives access to understanding how many traders are trading in a market, and identifies areas of support and resistance. Furthermore, the Forex charts are used to technically analyze the markets before making a trade. That means, wise Traders extensively use this research method. So, an FX Chart shows you what have been the price movements of a particular currency pair during a given time frame.
Different Types of Forex Chart
There are various types of forex charts that one can use. Although the forex charts from around the world may differ according to the period specified. And, the frequency of fluctuation of a currency pair there is a few common types of charts that are mostly used.
Today, I am going to explain the three most popular forex chart that is used by 99% of forex traders. Here are the three most popular types of Forex charts:
- Line Chart
- Bar Chart
- Candlestick Chart
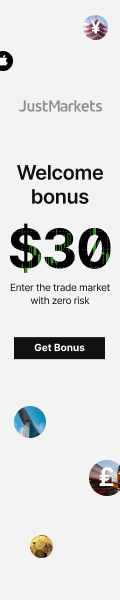
1. Line Chart:
A line chart is the basic type of chart and joins the closing price of a currency pair to the next one. It shows you the general price movement over a while. And, the Line charts only have basic information plotted on the chart, which means there is not a lot of clutter to get in the way of analysis. Yes, it only plots the closing price. And, a trader can create a line chart by marking the closing price of every trading time and then connecting every closing price with a line.
The benefits of line charts are-
- They are simple to study.
- Easy visual understanding.
- Give an overall idea of how a currency pair has performed during a specific timeframe.
- It is good for a starting point but it does not provide enough data.
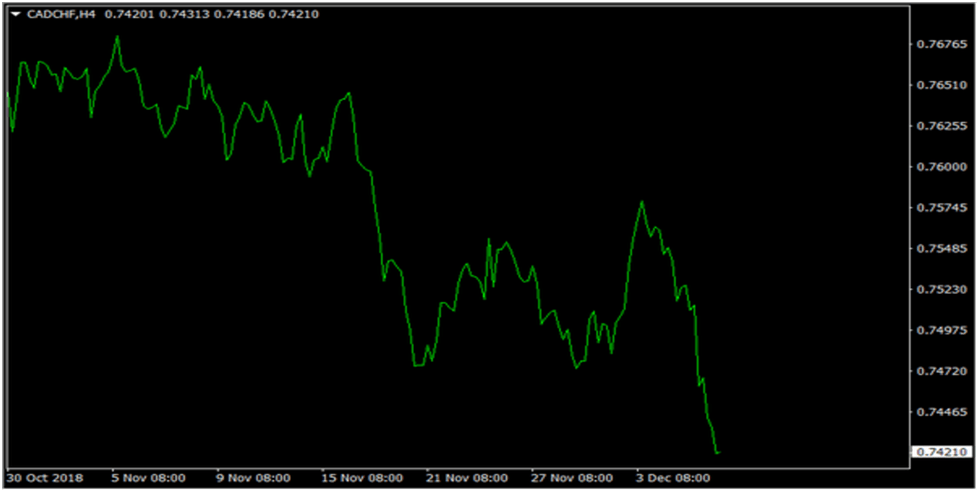
2. Bar Chart:
This chart is a little more complex in comparison to the simple line charts. Because it shows more information than a line chart. They not only show you the opening and closing prices of a pair, but also the high and low indicators of the opening price. The bottom of the vertical bar indicates the lowest trading price and the top shows the highest one.
Bar Chart demonstrates both the currency price and the movement in a particular direction. So, Technical analysts use bar charts to gain more information about how a currency pair’s price moved up and down during every trading period.
You can create a bar chart by plotting a series of bars across the chart. Each bar represents one trading period.
- To create a bar, you plot the high and low prices of a trading period and connect them with a vertical line.
- Next, you plot the opening price out to the left side of the vertical line you have just drawn and connect that point to the vertical line with a horizontal line.
- Last, you plot the closing price out to the right side of the vertical line you have just drawn. And connect that point to the vertical line with a horizontal line.
That means the Bar charts help traders identify where a currency pair started in the trading period and where it ended the trading period.
- If the price closes higher than it opened, you know investors were bullish on the currency pair.
- If the price closes lower than it opened, you know investors were bearish on the currency pair.
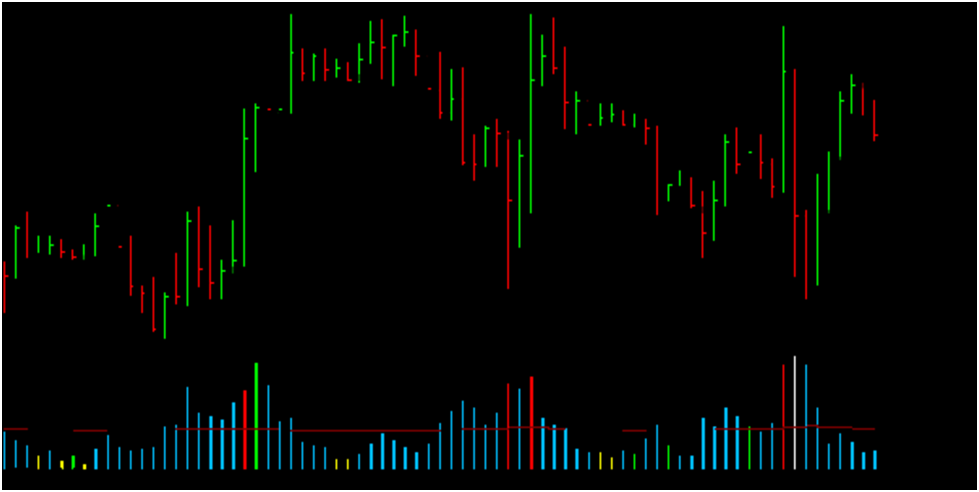
3. Candlestick Chart:
The Candlestick chart is made by the Japanese. It is the most useful among the three main chart types. This is a very common chart that shows data such as the opening and closing figures, the low and the high as well as the currency rates, and all this information is shown in the form of a candle with a wick at both ends.
You can create a candlestick chart by plotting a series of candlesticks across the chart. Each candlestick represents one trading period.
- To create a candlestick, you plot the high and low prices of a trading period and connect them with a vertical line. This line is called the wick of the candle.
- Next, you plot the opening price by drawing a horizontal line through the vertical line, or wick.
- After you have plotted the opening price, you plot the closing price by drawing another horizontal line through the vertical line.
- Lastly, you fill in the area between the opening price and the closing price. This area is called the body of the candlestick.
Candlestick chart shows the high to low range of a price movement with a vertical bar, just that the bar is either hollow or filled.
- Now if this body is green or hollow, it means the closing price was higher than the opening price.
- But if the body is red or filled from the inside, then the opening price was higher than the closing price.
Candlestick chart provides the same information as bar charts but in a slightly different format. Moreover, Technical analysts often use candlestick charts instead of bar charts because it is easier to see and identify various trading patterns.
What Forex Charts Are Trying to Tell You?
After reading Forex Chart, it is a vital point to understand the FX chart patterns. So that you can observe everything while you are trading and get more information in terms of future prices.
There are numerous patterns all according to the shapes that the prey that you will see on the play graph. Let me explain some of the most used Forex chart patterns.
● Time Frame
It is the most vital point for every trader. Time is represented on the X-axis and exchange rate price is on the Y-axis. If you want to see historical data, move left to the chart. The downtrend is identified by looking for a line that moves downwards, whereas an uptrend is depicted by a line moving upwards from left to right.
● Reversal
When It comes to the reversal trend information, you should consider one or more of the following patterns:
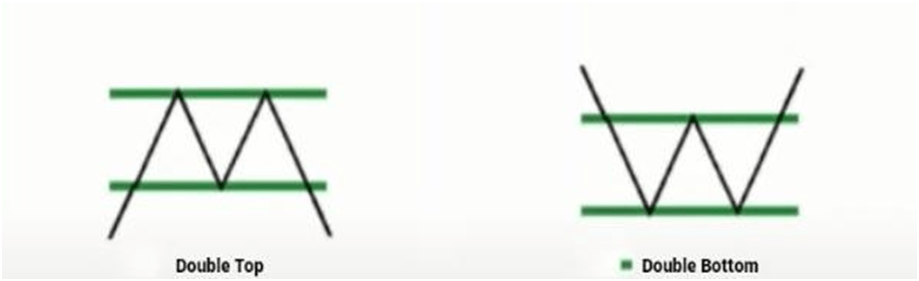
- Double Top & Double Bottom: These are reversal pattern that touches either the support or resistance and connects the two most recent high and low a price.
- How to Calculate:
Double Top: T= S-H, Where T- Target label; R= Resistance Label (Recent High); H= Pattern’s Height
Double Bottom: T=R+H, Where T- Target label; R= Resistance Label (Recent High); H= Pattern’s Height
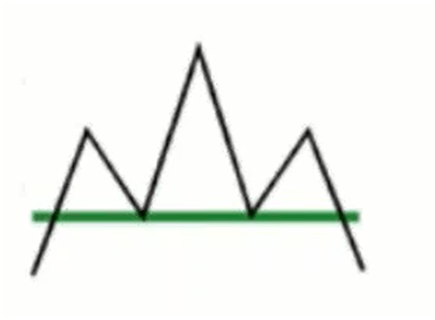
- Head and Shoulders: A Head & Shoulder pattern describes price movement. It is a reversal pattern from a bullish trend to a bearish trend. The pattern starts when prices cross the support line upwards before the formation of the left shoulder. And it is completed once the graph crosses the support line downwards after the formation of the right shoulder.
- How to Calculate:
T=N-(H-N), Where T= Target Level, N=Neckline Level, H=Patterns Head Level
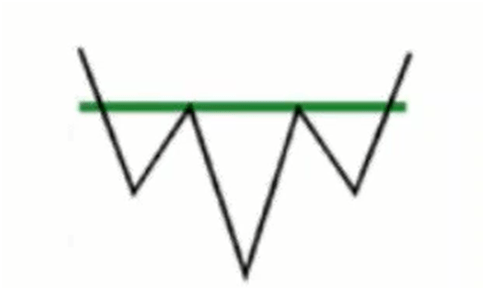
- Inverse Head and Shoulders: A inverse Head and Shoulder are similar in shape except that it is upside down and indicate a reversal from a bearish to a bullish trend.
- How to Calculate:
T=N+(N-H); Where T= Target Level, N=Neckline Level, H=Patterns Head Level
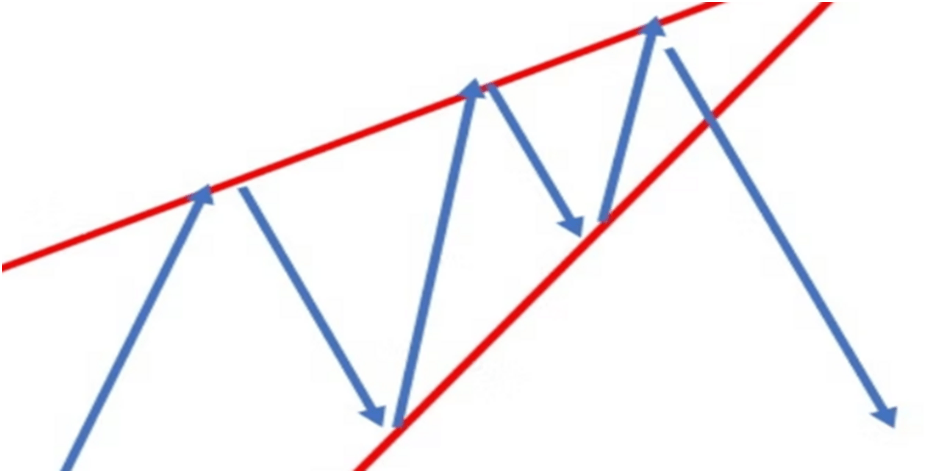
- Rising Wedge: It is like an ascending wedge, this bearish pattern often forms during an uptrend and a reversal or continuation trend. You should look up rising sloping support and resistance lines. If this pattern shows just after an uptrend it usually indicates a reversal pattern, so you can expect the price to start dropping again.
● Continuation
When it comes to the continuation trend formation, you should consider one of the following patterns:
- Rising Wedge & Falling Wedge: Wedges with positive slots are called rising wedges. On the other hand, wedges with negative slots are called falling wedges.
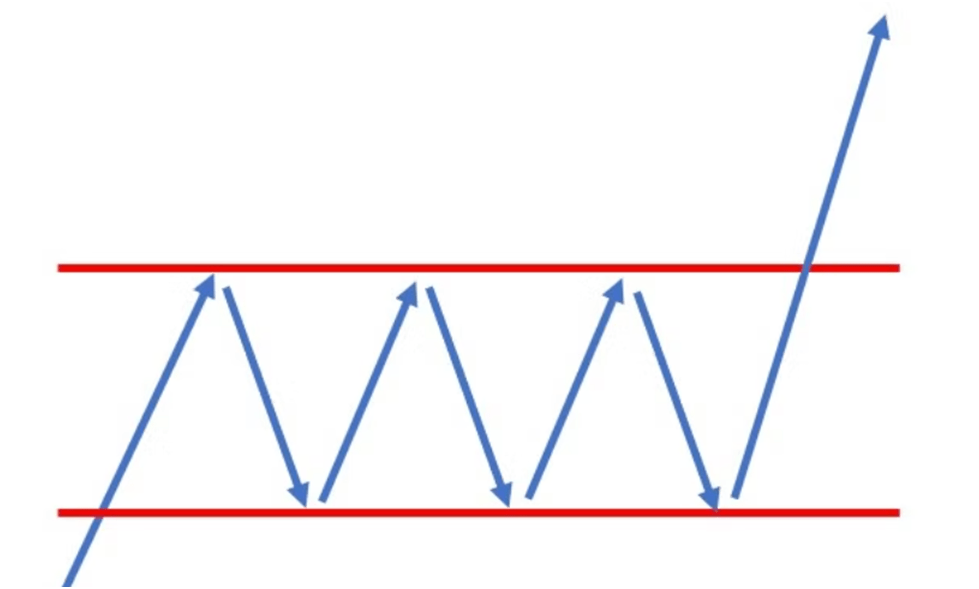
- Bearish Rectangle: Bearish Rectangle patterns appear when the support and resistance levels of the price are parallel. A bearish rectangle appears when the price increases for a period during a downtrend. If you consider this pattern, you can expect that the price will continue to fall.
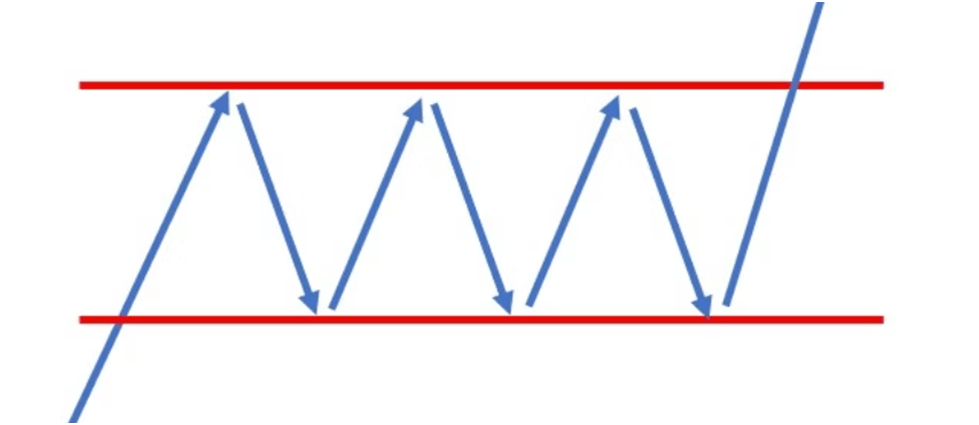
- Bullish Rectangle: A bullish rectangle appears when it goes uptrend. If you consider this pattern, you can expect the price to continue going up.
- Bearish Pennant: In a forex chart, this can be identified by a small symmetrical triangle shape called a pennant. Bearish pennants can be vertical, steep downturns.
When the price drops, some traders may choose to close their positions whereas others consider joining the trend. That means the price consolidates for a short time.
Yes, when maximum sellers have moved into the trade, the price drops and continues moving down.
- Bullish Pennant: Bullish pennant patterns are the opposite of the bearish peanut.
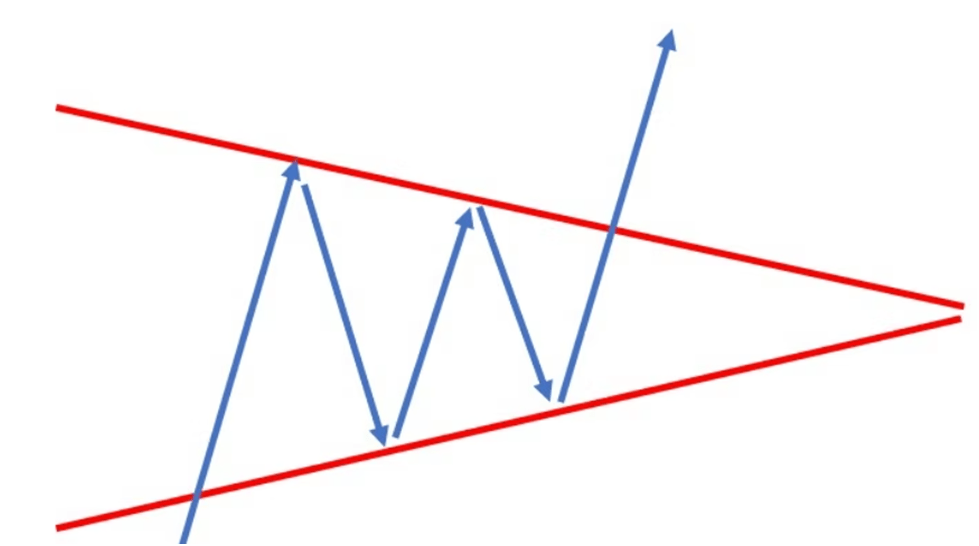
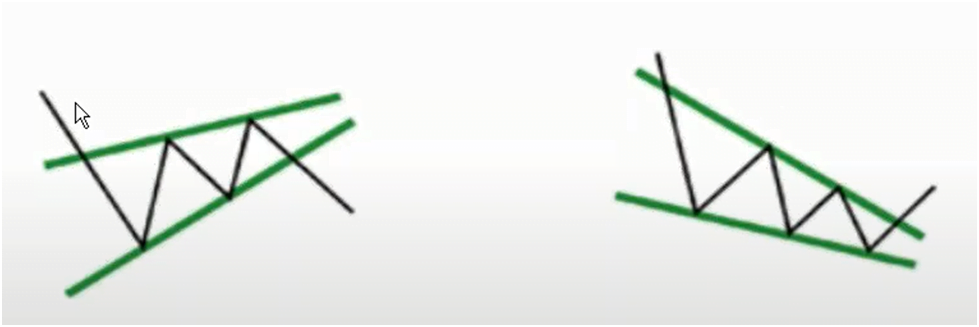
● Triangles
A triangle is formed converging between support and resistance lines. A negative sloping resistance line indicates a reduced level of profit-taking.
On the other hand, a positive sloping resistance line indicates an increased level of profit-taking. There are three different types of triangles Forex chat:
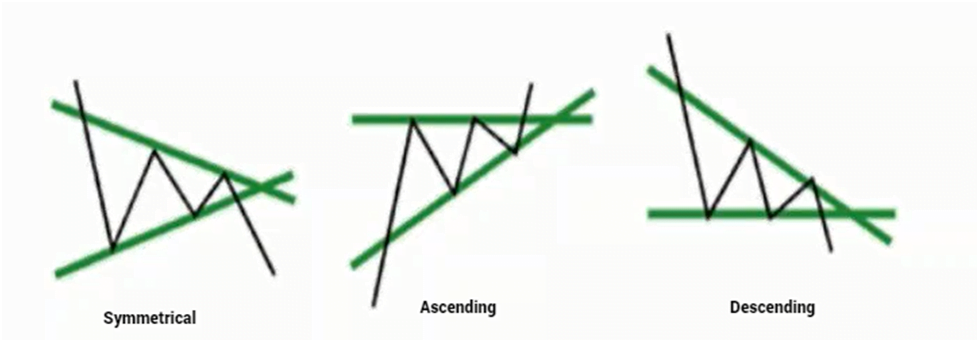
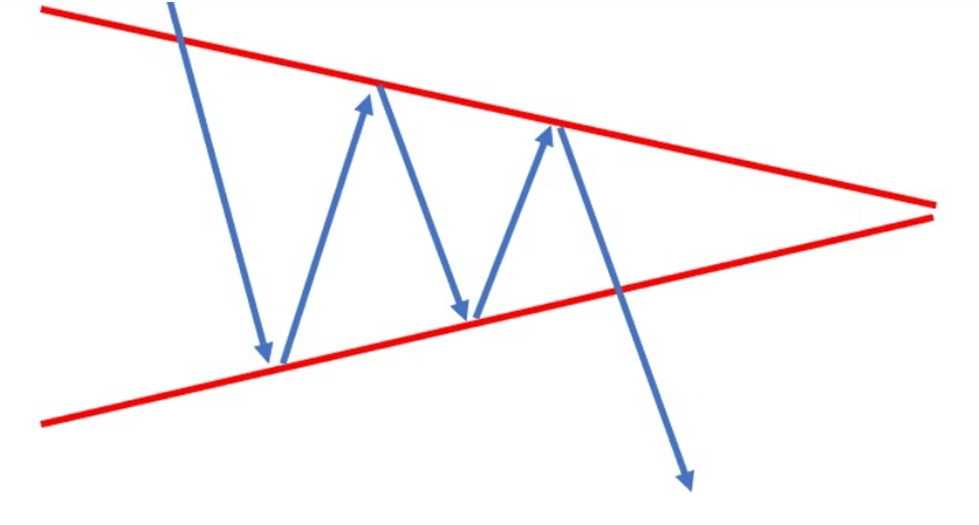
- Symmetrical Triangle: Symmetrical triangle, where the incline of the price’s highs and the decline of the price’s lows are equal. When it appears, it’s impossible to predict which direction the market will eventually break out in.
- Ascending Triangle: Ascending angle, where appears one strong up trending angle. And one horizontal angle at a defending triangle which consists of a horizontal line and intersecting trendline. This pattern indicates a clear point of resistance, but the lows can be observed as increasing.
- Descending Triangle: This pattern is the opposite of an ascending triangle. It has a support level line which the price doesn’t seem to be able to break. Also, it is a series of lower highs that creates the upper line of the triangle.
Importance Of Reading Forex Charts For Beginners
Forex chart reading is important for beginners because they provide valuable information that can help beginners make informed decisions about their trades. By reading forex charts and patterns, novice FX traders can learn about market trends, currency values, and other important information that can help to make successful trades. Now I am going to present some important key factors below.
- To Get Competitive Advantage: Recognizing Forex charts and patterns helps one to gain a competitive advantage in the market. And, this knowledge will also increase the value of your future technical analysis and technical indicators. As we all know, Technical analysis helps traders to know the past market prices. On the other hand, technical indicators predict the future movement of an investment.
- Reduce The Chance of Falling: When beginners start trading without knowing the forex chart and patterns, there is a higher chance of falling. It happens mostly to beginners.
I have already described in the above- Line Chart, Bar Chart, Candlestick Chart, Time Frame Patterns, Reversal Patterns, Continuation Patterns, and Triangle patterns. These Forex charts and patterns help traders to predict the movement of a currency’s value.
It also allows the traders to know about the strengths and weaknesses of the particular stock. And, the past performance of that currency pair. So, traders can make an informed decision about the potential future trade in the FX market beforehand and make their entry and exit accordingly.
- To Get Basic Idea: Forex Chart helps investors to know about forex international markets, generally the currency pair such as EUR or USD and the GBP or USD currency pair.
- Beget Trading Technique: Forex is similar to other businesses. So, one should have a business plan. After reading the Forex chart and patterns mentioned above, it is quite easy to invest in the market. And, also then- a starter knows when to stop trading.
- To Build A Successful Career In International Market: Forex chart patterns are the primary step for beginners to enter the International market. Studying forex charts can help you gain a better understanding of the global economy and how different currency pairs interact with each other. And that helps any trader to cut an edge in their trading career.
In addition, keeping up with current events and economic data releases can also help you make informed decisions about when to buy or sell certain currencies.
- Forex Demands Continuous Learning: Forex trading is a very difficult business and it needs a lot of knowledge and skills. To be a successful forex trader, one must have a good understanding of the market and the different factors that affect it.
So, it is essential that - one must also be able to read and interpret forex charts. They give the trader a clear picture of the market trend. Furthermore, the charts also help the trader to identify the right time to buy or sell a currency pair.
Some Essential FAQs
What Is Forex Chart?
- A forex chart is a price chart that helps traders to recognize patterns, gives access to understanding how many traders are trading in a market, and identifies areas of support and resistance.
What Is Support and Resistance in Forex Chart?
- Support occurs when falling prices stop, change direction, and begin to rise. It is often viewed as a floor that is supporting or holding up, prices.
Resistance is a price level where rising prices stop, change direction, and begin to fall. Resistance is often viewed as a ceiling keeping prices from rising higher.
What Is a Japanese Candlestick Chart in Forex?
- A candlestick chart is one of the most popular types of forex charts used by traders. Candlestick charts show the price movement of security over some time. Each candlestick on the chart represents the price action of the security over a certain period, typically one day.
Candlestick charts are useful for identifying potential reversals in the price of a security. The patterns that emerge from candlestick charts can provide clues about the future direction of the security's price.
What To Look for In Forex Charts?
- When looking at forex charts, you should look for certain indicators that can give you information about the current and future trends of the market. These indicators can include moving averages, and support and resistance levels.
Which Forex Chart Is Best to Predict From?
- Some popular forex chart types include candlestick charts, bar charts, and line charts. Ultimately, it is up to the individual trader to experiment with different chart types and determine which one works best for their purposes. In my opinion, the Candlestick chart is the best to predict from.
What Are the Forex Charts Used For?
- The Forex charts are used to track the movements of the different currency pairs.
What are Chart Patterns in Forex?
- There is no definitive answer to this question as chart patterns are highly subjective and can be interpreted in several ways. Some common chart patterns that forex traders look for include head and shoulders, double tops and bottoms, triangles, continuation, and reversal. These patterns can give traders an idea of where the market may be headed and can be used to make trading decisions.
Do Chart Patterns Work in Forex?
- While there is no surefire answer, many chart patterns do seem to work quite well in the forex market. Many traders believe that chart patterns can be used to predict future market movements. Also, there is certainly a lot of evidence to support this claim.
What Do Closing and Opening Mean in Forex Trading?
- Closing a trade means selling the open position to terminate the trade. Opening a trade means buying the currency pair to initiate the trade.
What Are the Best Forex Chart Viewers?
There are a few different types of forex chart viewers available to traders. Some are more basic than others, while some provide more features and options.
- The most popular type of forex chart viewer is the MetaTrader 4 (MT4) platform. This is a free platform that can be downloaded from the internet. It is widely used by forex traders around the world and offers a wide range of features, including a built-in charting package.
- Another popular type of forex chart viewer is the Web Trader platform. This is a web-based platform that allows traders to trade directly from their web browser. It is very user-friendly and offers a wide range of features, including a built-in charting package.
- The third type of forex chart viewer is the Trade Station platform. This is a desktop-based platform that offers a wide range of features, including a built-in charting package. It is very user-friendly and offers a wide range of features, including a built-in charting package.
How Do You Make a Forex Chart?
There are a few different ways to make a forex chart. The most common way is to use a charting software program that is specifically designed for forex trading. These programs usually have a wide variety of different features that allow you to customize your chart to fit your specific trading needs.
Another way to make a forex chart is to use a spreadsheet program such as Microsoft Excel. Here, you can create a basic chart using the built-in charting tools that are available in most spreadsheet programs. However, if you want to add more advanced features to your chart, you will need to purchase a separate charting software program.
How To Analyze a Forex Chart?
The best way to analyze a forex chart will vary depending on the trader's individual goals and preferences. However, some tips on how to analyze a forex chart may include
- studying price action to identify support and resistance levels,
- using technical indicators to help spot trading opportunities,
- and keeping an eye on economic news releases that could impact the currency pair being traded.
So, Why Learning Is Important in Forex?
There are a few key reasons why learning is important in forex.
- First, the foreign exchange market is constantly changing and evolving. So it is important to keep up with the latest changes to make informed trading decisions.
- Secondly, forex trading involves a significant amount of risk. That’s why it is important to learn as much as possible about the market to minimize your risk.
- Finally, forex trading is a complex process, so it is mandatory to learn as much as possible to avoid making costly mistakes.
Conclusion
The importance of reading forex charts for beginners is essential. Because it provides a visual representation of the market. This allows beginners to see the market trends and make informed decisions about trading. Additionally, forex charts can help beginners to identify entry and exit points, as well as set stop-loss and take-profit orders.
Write a Comment
Importance Of Reading Forex Charts for Beginners
Forex trading is the jungle of smart people and professionals who love and play with skilled investment
Forex trading is the jungle of smart people and professionals who love and play with skilled investment. So, if you are a beginner to this lavish bunch, then one of the first things you need to learn is how to read forex charts.
Charts are an essential tool for all traders, providing valuable information that can help you make more informed and successful trades. In this article, I have covered everything that you need to get a better overview of the importance of reading forex charts and patterns for beginners. So, let me get started.
What is a Forex Chart?
A forex chart is a price chart that helps traders to recognize patterns, gives access to understanding how many traders are trading in a market, and identifies areas of support and resistance. Furthermore, the Forex charts are used to technically analyze the markets before making a trade. That means, wise Traders extensively use this research method. So, an FX Chart shows you what have been the price movements of a particular currency pair during a given time frame.
Different Types of Forex Chart
There are various types of forex charts that one can use. Although the forex charts from around the world may differ according to the period specified. And, the frequency of fluctuation of a currency pair there is a few common types of charts that are mostly used.
Today, I am going to explain the three most popular forex chart that is used by 99% of forex traders. Here are the three most popular types of Forex charts:
- Line Chart
- Bar Chart
- Candlestick Chart
1. Line Chart:
A line chart is the basic type of chart and joins the closing price of a currency pair to the next one. It shows you the general price movement over a while. And, the Line charts only have basic information plotted on the chart, which means there is not a lot of clutter to get in the way of analysis. Yes, it only plots the closing price. And, a trader can create a line chart by marking the closing price of every trading time and then connecting every closing price with a line.
The benefits of line charts are-
- They are simple to study.
- Easy visual understanding.
- Give an overall idea of how a currency pair has performed during a specific timeframe.
- It is good for a starting point but it does not provide enough data.
2. Bar Chart:
This chart is a little more complex in comparison to the simple line charts. Because it shows more information than a line chart. They not only show you the opening and closing prices of a pair, but also the high and low indicators of the opening price. The bottom of the vertical bar indicates the lowest trading price and the top shows the highest one.
Bar Chart demonstrates both the currency price and the movement in a particular direction. So, Technical analysts use bar charts to gain more information about how a currency pair’s price moved up and down during every trading period.
You can create a bar chart by plotting a series of bars across the chart. Each bar represents one trading period.
- To create a bar, you plot the high and low prices of a trading period and connect them with a vertical line.
- Next, you plot the opening price out to the left side of the vertical line you have just drawn and connect that point to the vertical line with a horizontal line.
- Last, you plot the closing price out to the right side of the vertical line you have just drawn. And connect that point to the vertical line with a horizontal line.
That means the Bar charts help traders identify where a currency pair started in the trading period and where it ended the trading period.
- If the price closes higher than it opened, you know investors were bullish on the currency pair.
- If the price closes lower than it opened, you know investors were bearish on the currency pair.
3. Candlestick Chart:
The Candlestick chart is made by the Japanese. It is the most useful among the three main chart types. This is a very common chart that shows data such as the opening and closing figures, the low and the high as well as the currency rates, and all this information is shown in the form of a candle with a wick at both ends.
You can create a candlestick chart by plotting a series of candlesticks across the chart. Each candlestick represents one trading period.
- To create a candlestick, you plot the high and low prices of a trading period and connect them with a vertical line. This line is called the wick of the candle.
- Next, you plot the opening price by drawing a horizontal line through the vertical line, or wick.
- After you have plotted the opening price, you plot the closing price by drawing another horizontal line through the vertical line.
- Lastly, you fill in the area between the opening price and the closing price. This area is called the body of the candlestick.
Candlestick chart shows the high to low range of a price movement with a vertical bar, just that the bar is either hollow or filled.
- Now if this body is green or hollow, it means the closing price was higher than the opening price.
- But if the body is red or filled from the inside, then the opening price was higher than the closing price.
Candlestick chart provides the same information as bar charts but in a slightly different format. Moreover, Technical analysts often use candlestick charts instead of bar charts because it is easier to see and identify various trading patterns.
What Forex Charts Are Trying to Tell You?
After reading Forex Chart, it is a vital point to understand the FX chart patterns. So that you can observe everything while you are trading and get more information in terms of future prices.
There are numerous patterns all according to the shapes that the prey that you will see on the play graph. Let me explain some of the most used Forex chart patterns.
● Time Frame
It is the most vital point for every trader. Time is represented on the X-axis and exchange rate price is on the Y-axis. If you want to see historical data, move left to the chart. The downtrend is identified by looking for a line that moves downwards, whereas an uptrend is depicted by a line moving upwards from left to right.
● Reversal
When It comes to the reversal trend information, you should consider one or more of the following patterns:
- Double Top & Double Bottom: These are reversal pattern that touches either the support or resistance and connects the two most recent high and low a price.
- How to Calculate:
Double Top: T= S-H, Where T- Target label; R= Resistance Label (Recent High); H= Pattern’s Height
Double Bottom: T=R+H, Where T- Target label; R= Resistance Label (Recent High); H= Pattern’s Height
- Head and Shoulders: A Head & Shoulder pattern describes price movement. It is a reversal pattern from a bullish trend to a bearish trend. The pattern starts when prices cross the support line upwards before the formation of the left shoulder. And it is completed once the graph crosses the support line downwards after the formation of the right shoulder.
- How to Calculate:
T=N-(H-N), Where T= Target Level, N=Neckline Level, H=Patterns Head Level
- Inverse Head and Shoulders: A inverse Head and Shoulder are similar in shape except that it is upside down and indicate a reversal from a bearish to a bullish trend.
- How to Calculate:
T=N+(N-H); Where T= Target Level, N=Neckline Level, H=Patterns Head Level
- Rising Wedge: It is like an ascending wedge, this bearish pattern often forms during an uptrend and a reversal or continuation trend. You should look up rising sloping support and resistance lines. If this pattern shows just after an uptrend it usually indicates a reversal pattern, so you can expect the price to start dropping again.
● Continuation
When it comes to the continuation trend formation, you should consider one of the following patterns:
- Rising Wedge & Falling Wedge: Wedges with positive slots are called rising wedges. On the other hand, wedges with negative slots are called falling wedges.
- Bearish Rectangle: Bearish Rectangle patterns appear when the support and resistance levels of the price are parallel. A bearish rectangle appears when the price increases for a period during a downtrend. If you consider this pattern, you can expect that the price will continue to fall.
- Bullish Rectangle: A bullish rectangle appears when it goes uptrend. If you consider this pattern, you can expect the price to continue going up.
- Bearish Pennant: In a forex chart, this can be identified by a small symmetrical triangle shape called a pennant. Bearish pennants can be vertical, steep downturns.
When the price drops, some traders may choose to close their positions whereas others consider joining the trend. That means the price consolidates for a short time.
Yes, when maximum sellers have moved into the trade, the price drops and continues moving down.
- Bullish Pennant: Bullish pennant patterns are the opposite of the bearish peanut.
● Triangles
A triangle is formed converging between support and resistance lines. A negative sloping resistance line indicates a reduced level of profit-taking.
On the other hand, a positive sloping resistance line indicates an increased level of profit-taking. There are three different types of triangles Forex chat:
- Symmetrical Triangle: Symmetrical triangle, where the incline of the price’s highs and the decline of the price’s lows are equal. When it appears, it’s impossible to predict which direction the market will eventually break out in.
- Ascending Triangle: Ascending angle, where appears one strong up trending angle. And one horizontal angle at a defending triangle which consists of a horizontal line and intersecting trendline. This pattern indicates a clear point of resistance, but the lows can be observed as increasing.
- Descending Triangle: This pattern is the opposite of an ascending triangle. It has a support level line which the price doesn’t seem to be able to break. Also, it is a series of lower highs that creates the upper line of the triangle.
Importance Of Reading Forex Charts For Beginners
Forex chart reading is important for beginners because they provide valuable information that can help beginners make informed decisions about their trades. By reading forex charts and patterns, novice FX traders can learn about market trends, currency values, and other important information that can help to make successful trades. Now I am going to present some important key factors below.
- To Get Competitive Advantage: Recognizing Forex charts and patterns helps one to gain a competitive advantage in the market. And, this knowledge will also increase the value of your future technical analysis and technical indicators. As we all know, Technical analysis helps traders to know the past market prices. On the other hand, technical indicators predict the future movement of an investment.
- Reduce The Chance of Falling: When beginners start trading without knowing the forex chart and patterns, there is a higher chance of falling. It happens mostly to beginners.
I have already described in the above- Line Chart, Bar Chart, Candlestick Chart, Time Frame Patterns, Reversal Patterns, Continuation Patterns, and Triangle patterns. These Forex charts and patterns help traders to predict the movement of a currency’s value.
It also allows the traders to know about the strengths and weaknesses of the particular stock. And, the past performance of that currency pair. So, traders can make an informed decision about the potential future trade in the FX market beforehand and make their entry and exit accordingly.
- To Get Basic Idea: Forex Chart helps investors to know about forex international markets, generally the currency pair such as EUR or USD and the GBP or USD currency pair.
- Beget Trading Technique: Forex is similar to other businesses. So, one should have a business plan. After reading the Forex chart and patterns mentioned above, it is quite easy to invest in the market. And, also then- a starter knows when to stop trading.
- To Build A Successful Career In International Market: Forex chart patterns are the primary step for beginners to enter the International market. Studying forex charts can help you gain a better understanding of the global economy and how different currency pairs interact with each other. And that helps any trader to cut an edge in their trading career.
In addition, keeping up with current events and economic data releases can also help you make informed decisions about when to buy or sell certain currencies.
- Forex Demands Continuous Learning: Forex trading is a very difficult business and it needs a lot of knowledge and skills. To be a successful forex trader, one must have a good understanding of the market and the different factors that affect it.
So, it is essential that - one must also be able to read and interpret forex charts. They give the trader a clear picture of the market trend. Furthermore, the charts also help the trader to identify the right time to buy or sell a currency pair.
Some Essential FAQs
What Is Forex Chart?
- A forex chart is a price chart that helps traders to recognize patterns, gives access to understanding how many traders are trading in a market, and identifies areas of support and resistance.
What Is Support and Resistance in Forex Chart?
- Support occurs when falling prices stop, change direction, and begin to rise. It is often viewed as a floor that is supporting or holding up, prices.
Resistance is a price level where rising prices stop, change direction, and begin to fall. Resistance is often viewed as a ceiling keeping prices from rising higher.
What Is a Japanese Candlestick Chart in Forex?
- A candlestick chart is one of the most popular types of forex charts used by traders. Candlestick charts show the price movement of security over some time. Each candlestick on the chart represents the price action of the security over a certain period, typically one day.
Candlestick charts are useful for identifying potential reversals in the price of a security. The patterns that emerge from candlestick charts can provide clues about the future direction of the security's price.
What To Look for In Forex Charts?
- When looking at forex charts, you should look for certain indicators that can give you information about the current and future trends of the market. These indicators can include moving averages, and support and resistance levels.
Which Forex Chart Is Best to Predict From?
- Some popular forex chart types include candlestick charts, bar charts, and line charts. Ultimately, it is up to the individual trader to experiment with different chart types and determine which one works best for their purposes. In my opinion, the Candlestick chart is the best to predict from.
What Are the Forex Charts Used For?
- The Forex charts are used to track the movements of the different currency pairs.
What are Chart Patterns in Forex?
- There is no definitive answer to this question as chart patterns are highly subjective and can be interpreted in several ways. Some common chart patterns that forex traders look for include head and shoulders, double tops and bottoms, triangles, continuation, and reversal. These patterns can give traders an idea of where the market may be headed and can be used to make trading decisions.
Do Chart Patterns Work in Forex?
- While there is no surefire answer, many chart patterns do seem to work quite well in the forex market. Many traders believe that chart patterns can be used to predict future market movements. Also, there is certainly a lot of evidence to support this claim.
What Do Closing and Opening Mean in Forex Trading?
- Closing a trade means selling the open position to terminate the trade. Opening a trade means buying the currency pair to initiate the trade.
What Are the Best Forex Chart Viewers?
There are a few different types of forex chart viewers available to traders. Some are more basic than others, while some provide more features and options.
- The most popular type of forex chart viewer is the MetaTrader 4 (MT4) platform. This is a free platform that can be downloaded from the internet. It is widely used by forex traders around the world and offers a wide range of features, including a built-in charting package.
- Another popular type of forex chart viewer is the Web Trader platform. This is a web-based platform that allows traders to trade directly from their web browser. It is very user-friendly and offers a wide range of features, including a built-in charting package.
- The third type of forex chart viewer is the Trade Station platform. This is a desktop-based platform that offers a wide range of features, including a built-in charting package. It is very user-friendly and offers a wide range of features, including a built-in charting package.
How Do You Make a Forex Chart?
There are a few different ways to make a forex chart. The most common way is to use a charting software program that is specifically designed for forex trading. These programs usually have a wide variety of different features that allow you to customize your chart to fit your specific trading needs.
Another way to make a forex chart is to use a spreadsheet program such as Microsoft Excel. Here, you can create a basic chart using the built-in charting tools that are available in most spreadsheet programs. However, if you want to add more advanced features to your chart, you will need to purchase a separate charting software program.
How To Analyze a Forex Chart?
The best way to analyze a forex chart will vary depending on the trader's individual goals and preferences. However, some tips on how to analyze a forex chart may include
- studying price action to identify support and resistance levels,
- using technical indicators to help spot trading opportunities,
- and keeping an eye on economic news releases that could impact the currency pair being traded.
So, Why Learning Is Important in Forex?
There are a few key reasons why learning is important in forex.
- First, the foreign exchange market is constantly changing and evolving. So it is important to keep up with the latest changes to make informed trading decisions.
- Secondly, forex trading involves a significant amount of risk. That’s why it is important to learn as much as possible about the market to minimize your risk.
- Finally, forex trading is a complex process, so it is mandatory to learn as much as possible to avoid making costly mistakes.
Conclusion
The importance of reading forex charts for beginners is essential. Because it provides a visual representation of the market. This allows beginners to see the market trends and make informed decisions about trading. Additionally, forex charts can help beginners to identify entry and exit points, as well as set stop-loss and take-profit orders.
| # | Forex Broker | Year | Status | For | Against | Type | Regulation | Leverage | Account | Advisors | ||
| 1 |  |
JustMarkets | 2012 | 36% | 4% | ECN/STP | FSA, CySEC, FSCA, FSC | 1:3000* | 1 | Yes | ||
|---|---|---|---|---|---|---|---|---|---|---|---|---|
| 2 |  |
Hantec Markets | 1990 | 35% | 6% | ECN/STP | ASIC, FCA, FSA-Japan, FSC, JSC | 1:2000* | 100 | Yes | ||
| 3 |  |
Valetax | 2023 | 35% | 1% | ECN/STD | FSC | 1:2000* | 10 | Yes | ||
| 4 |  |
KCM Trade | 2016 | 32% | 3% | ECN/STD | FSC | 1:400* | 100 | Yes | ||
| 5 |  |
Plotio | 1983 | 31% | 2% | STP | HKGX, ASIC, SCB | 1:300* | 200 | Yes | ||
| 6 |  |
FISG | 2011 | 30% | 1% | ECN/STD | FSA, CySEC, ASIC | 1:500 | 0.01 | Yes | ||
| 7 | ATFX | 2017 | 25% | 3% | Broker/NDD | FCA, CySEC, FSCA | 1:400* | 100 | Yes | |||
| 8 |  |
Octa | 2011 | 20% | 3% | ECN/STD | Regulation: CySEC, MISA, FSCA and FSC | 1:1000* | 5 | Yes | ||
| 9 | Youhodler | 2018 | 20% | 2% | Exchange | EU (Swiss) licensed | Up to 1:500 | 100 | Yes | |||
| 10 | Uniglobe markets | 2015 | 20% | 3% | ECN/STP | Yes | Up to 1:500 | 100 | Yes | |||
| 11 | IEXS | 2023 | 20% | 6% | ECN/STP | ASIC, FCA | Up to 1:500 | 100 | Yes | |||
| 12 |  |
TradeEU | 2023 | 18% | 4% | CFDs | CySEC | 1:300* | 100 | Yes | ||
| 13 |  |
RoboForex | 2009 | 16% | 4% | ECN/STD | FSC, Number 000138/333 | 1:2000* | 10 | Yes | ||
| 14 |  |
Axiory | 2011 | 15% | 5% | Broker, NDD | IFSC, FSC, FCA (UK) | 1:777* | 10 | Yes | ||
| 15 |  |
FBS | 2009 | 13% | 4% | ECN/STD | IFSC, CySEC, ASIC, FSCA | 1:3000* | 100 | Yes |